Talking about the heat ….
Talking about the Heat – Talking Points
We’ve gathered together information about the current heatwave and climate change for use in conversations or presentations. Research suggests that understanding your audience, establishing common ground and sharing stories all matter more than data in communicating around climate – but sometimes people ask for specific facts, too. So the idea is to make some of those facts easily accessible. Please let us know how you use the material; we’d love to know what does and doesn’t resonate with particular individuals or groups.
Yes, heatwaves and extreme high temperatures in particular places aren’t just a new phenomenon …
- This is true. The central US experienced extended heatwaves and set longstanding temperature records in the 1930s. And if you’re speaking to someone who remembers the UK’s heatwave in 1976, they may well bring that up, as the media frequently do (the BBC’s done a comparison of the 1976 and 2018 heatwaves for example)
And there are several factors involved in this event. But human-induced climate change is likely a key driver.
- Weather is complex and generally involves the interaction of multiple factors. In this heatwave, scientists have generally discussed four factors:
- higher background temperatures resulting from climate change
- North Atlantic sea temperatures
- the location of the jet stream, a band of high winds in the upper atmosphere
- and annual weather patterns
- So climate change would definitely be cited as a key driver, if only because of the importance of the rising temperatures.
- But in actuality, some of the other factors are also affected by climate change. For example the jet stream derives its strength from the difference between cold air coming from the Arctic and warm air from the tropics. Rapid warming in the Arctic means that there are smaller difference between the Arctic and the tropics. This can weaken the jet stream. A weak jet stream, then, can ‘stall’, leading to long periods of persistent high or low pressure in a given area … like the persistent high behind our heatwave. Indeed, a recent study which looked at various ways climate change was affecting atmospheric circulation concluded it was quite likely to create more ‘extreme extremes’
- This means that we may well be (to borrow language from cooking programmes) getting ‘climate change two ways’ – seeing its direct influence in the higher temperatures and its more complex influence as one of several factors in the way the atmosphere circulates.
Let’s start with the increase in global temperature. It’s a simple matter of observation that in recent years, the earth is getting hotter than it used to be …
- How much hotter overall? The trend towards higher temperatures goes back a few decades. Here’s one way of looking at things – Ed Hawkin’s ‘warming stripes’ which show the changes in global temperatures from 1850 to 2017. Dark blue represents the coolest temperatures; dark red (at the far right) the warmest.

- If the earth weren’t getting warmer, we’d expect a fairly random distribution of blues and reds. But as the stripes suggest, we have now had 402 consecutive months of global temperatures above the 20th century average. Moreover “seventeen of the 18 warmest years on record have all been during this century, and the degree of warming during the past three years has been exceptional.” (World Meteorological Organization’s head describing 2017) In fact, the global average surface temperatures in 2015, 2016 and 2017 were all more than 1 degree Celsius above the pre-industrial era.
- The high temperatures in 2017 are particularly striking, as, unlike in 2015 and 2016 there was no El Niño event – which tends to raise global average surface temperatures – in 2017.
- What about this year? From January to June of 2018, global surface temperatures were the 4th hottest on record according to National Oceanic and Atmospheric Administration data, and right now the Global Warming Index is at 1.03 degrees Centigrade. This is despite the fact that 2018 also has not, thus far, seen the appearance of an El Niño event.
This increase in global mean temperatures isn’t just a continuation of ‘normal’ natural processes, as some people argue. Human activity is the dominant cause.
- Both natural processes and human activity are involved in temperature changes. But, as Professor Myles Allen shows in a brilliant presentation covering the basic science of global warming (click on the links to see the videos), if you look at the warming that would be expected were only natural processes (primarily solar variability and volcanic activity) involved, it’s nowhere near as much as the warming we’ve seen in recent years. Indeed, estimates based on natural processes alone would suggest that temperatures should have gone down from 1970 … just when the current warming trend started. If you put together what we’d expect from natural processes with what we’d expect from increased emissions relating to human activity, however, you get something that corresponds quite closely to observed temperatures. This indicates that in the warming since the 1970s, human activity is the dominant factor.
- Here’s another great illustration, this one by Emanuele Bevacqua, inspired by the warming stripes of Ed Hawkins (used with permission – with thanks to both!) It shows how the mean global temperature increases (bottom panel) as a result of rising CO2 concentration (top panel). (Data: 1880-2017, @NASA, #UCSD)

So we’re starting from a hotter baseline overall. And as average temperatures get hotter, extreme heat events are also increasing in intensity, duration and frequency.
- As we increase greenhouse gas levels in the air and the overall temperature rises, this makes it more likely that extreme heat events will occur. If you’re mathematically inclined, one way to think about this is that if temperatures are normally within a range of probability, as the norm shifts towards higher temperatures, the likelihood of extreme lows diminishes, and the likelihood of extreme highs increases. Another analogy scientists often use is that of an athlete on steroids. If a baseball player, for example, is made stronger by steroids, not every swing at a ball will be a home run – there are too many different factors involved. But more will be, just because he has more power. In the same way, the average temperature rises don’t mean there will never be extreme lows – but extreme heat will be far more frequent.
- And we’re seeing just that. If you look at 2018, a map of national temperature records (both monthly and all-time) through 18 July indicates only four record lows but fifty-one record highs.
- Some of those record highs are extraordinary
- Our temperatures have been high for us: in the UK, on 28 June, Glasgow set an all time record of 31.9°C (89.4°F) and Belfast of 29.5°C (85.1°F)
- But take a look at some of the other temperatures globally. On April 30th, Nawabsha in Pakistan set a record for the hottest temperature for the month of April ever measured: 50.2°C (122.4°F)
- in early July, Ouargla, Algeria registered the highest temperature ever reliably recorded in Africa of 51.3°C (124.3°F)
- On June 25th, Qarayyat in Oman set a world record for the highest minimum temperature in a 24 hour period: 42.6°C (108.7°F)
- And you certainly wouldn’t have wanted to be taking children to visit Disneyland in California on the 6th of July; the maximum temperature nearby was 46.7°C (116°F)
- perhaps most surprising are some of the highs from the far North: July saw 32.2°C (90°F) in the capital of the Finnish province of Lapland on the 17th and 29.5°C (85.1°F) in Sweden’s northernmost weather station on the 18th. And in Siberia, the World Meteorological Organization noted that “the Western Siberian Hydromet Center of Russia issued a storm warning due to temperatures of more than 30°C for more than five days.”
- The fact that these high temperatures and extended heatwaves are so widespread is a clear marker of the changing climate. To go back to the comparison between 1976 and 2018, in June 1976 the UK’s exceptionally warm summer was a fairly isolated occurrence … as the map on the left below (which shows mean June temperatures relative to a 20th century baseline) shows. But in June 2018, in a hotter world, not only is the UK facing much hotter temperatures than usual, but so are much of the Northern hemisphere and Antarctica … and some of the most intense anomalies (especially those in northern Russia) are far more extreme than anything seen in June 1976. *
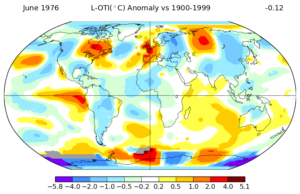
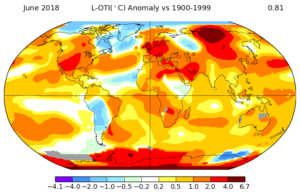
- Ref: https://data.giss.nasa.gov/gistemp/maps/
Temperature extremes and heatwaves can be deadly:
-
In Québec‘s recent heatwave, almost ninety people have died; in Japan, the recent extreme heat has killed more than eighty people and sent 23,000 to the hospital.
-
In Australia between 2000 and 2009, heatwaves killed 532 people.
-
In the heatwaves that hit India and Pakistan in 2015, at least 2,500 people were killed in India and at least 700 in Karachi (Pakistan) alone.
-
Estimates of the number of people killed in the European heatwave of 2003 range from about 20,000 to about 35,000 to even higher figures, with about 1050 heat-related deaths in Greater London and Central Paris alone.
- And the extreme heat can contribute to further disasters, like the current wildfires in Greece, that have killed dozens and destroyed whole towns.
But they shouldn’t be taking us by surprise. Such events have long been predicted by climate models.
Take a look at the Intergovernmental Panel on Climate Change’s reports over the years, and it’s clear …
- “Models described in the IPCC First Assessment Report (Mitchell et al., 1990) showed that a warmer mean temperature increases the probability of extreme warm days and decreases the probability of extreme cold days. This result has appeared consistently in a number of more recent different climate model configurations…” Climate Change 2001: Working Group 1 – The Physical Science Basis (IPCC- AR3)
- “It is very likely that heat waves will be more intense, more frequent and longer lasting in a future warmer climate.” Climate Change 2007: Working Group I- The Physical Science Basis (IPCC-AR4)
- “It is virtually certain that there will be more frequent hot and fewer cold temperature extremes over most land areas on daily and seasonal timescales as global mean temperatures increase. It is very likely that heat waves will occur with a higher frequency and duration.” Climate Change 2013: The Physical Science Basis – Summary for Policymakers (IPCC-AR5)
- “In most land regions the frequency of warm days and warm nights will likely increase in the next decades, while that of cold days and cold nights will decrease. Models project near-term increases in the duration, intensity and spatial extent of heat waves and warm spells. These changes may proceed at a different rate than the mean warming. For example, several studies project that European high-percentile summer temperatures warm faster than mean temperatures.” Climate Change 2013: The Physical Science Basis – Near-term Climate Change: Projections and Predictability (IPCC – AR5)
Until recently, though, it was hard to tell whether particular events were made more likely or more severe because of climate change. But it’s now become possible to do “attribution studies” for extreme heat events and some other climate-related phenomena.
In most, though not all, cases, when scientists did such studies of extreme heat events, they found that climate change has indeed made the events more likely or more severe.
- In 2017, Climate Brief stated that “of the 48 attribution studies that have looked at extreme heat around the world, 85% found that climate change had made an event of that kind more likely or more severe.”*
- To give some examples, World Weather Attribution (WWA) studies of individual events have shown that:
- The 2017 summer heat in Spain/Portugal was made at least ten times more likely by human-induced climate change
- The June 2017 heat in central England was made four times more likely
- Average summer temperatures like those found in New South Wales in 2017 are fifty times more likely than they were compared to early in the 20th century
- But not all heatwaves are related to climate change. For example, the WWA study of the 2016 Indian heatwave suggests it was not. It’s important to recognise this, as people who are uncertain about climate science often express the view that people concerned about the climate attribute too much to climate change.
The World Weather Attribution group has released preliminary findings for this heatwave as it affects northern Europe and concluded that climate change made it roughly twice as likely.
What does this mean for our future? If we keep on with current patterns of emissions, scientists are predicting that extreme heat events will continue to increase so that heat events we think of as extreme will become the norm … or even cooler than the norm:
- For example, Dr Andrew King, one of the WWA scientists who studied the European heat wave of 2017, stated that “Under a business as usual scenario, where we continue to increase our greenhouse gas emissions, we find that, in Europe, extreme heat events like June 2017 would be close to average by the end of this century.”
- A Met Office study suggested that under the IPCC’s various scenarios, summers like 2003 could be as frequent as every other year by the 2040s … and under its two higher emissions scenarios, summers like 2003 could be on the cool side of the norm by the 2050s.
And that could have devastating effects
-
The House of Common Environmental Audit Committee has released a report noting that “heatwaves threaten health, wellbeing and productivity” and that “The average number of heat-related deaths in the UK is expected to more than triple to 7,000 a year by the 2050s.”
But if we reduce our emissions dramatically in line with the Paris ambitions of keeping warming to 1.5 degrees, extreme heat events, while they’ll still increase, won’t increase as much:
- Going back to the articles mentioned above, Dr King noted that if we meet the Paris ambition of keeping global warming to 1.5°C, he “would expect very hot June temperatures in Portugal like this year’s to occur [in Europe] in about one in every four years.” If we get 2°C of global warming, however, “such heat would occur in about one in every three years on average.”
- And the Met Office study cited above suggests that while almost all scenarios will mean that once exceptional heat will become common in the UK by the 2040s, rapid action to stabilise emissions could significantly lessen the intensity of future heat extremes.
So the key variable in determining what happens in the future isn’t some uncertain force or scientific principle. It’s people. Including us. And people’s … our … choices.
The need to act is urgent. Really urgent. So what can we do?
For one thing, we can bring our concerns before God. We can ask God to guide us in our own responses. And we can pray for those who are making decisions for businesses and countries around the world …
- Some of the things that need to happen seem way too big for us to have any impact. But God is bigger than all of them. As Ruth Valerio reflected in ‘Making no sense if God does not exist’, prayer about the climate – entrusting our fears and concerns to God and asking God to act in our lives and in the wider world – is a radical act in itself
- More specifically, people may tell you that nothing we can do matters because China and India won’t change, and Donald Trump says that climate change isn’t real. But China and India are changing, and many state and city governments in the US are taking radical action regardless of Donald Trump. We can pray for people around the world who are caring for creation and offering hope.
- resources for prayer abound – take a look at Season of Creation, Pray and Fast for the Climate (which offers monthly prayer points relating to the latest news) Eco Church and CTBI for starters
We can find out our carbon footprint and take an individual pledge to reduce it. Some of the most effective ways to do this are
- switching to a green energy supplier for our electricity and gas – it’s easy and has a significant impact. An average UK household switching to renewable energy for its electricity would reduce its emissions by about 1.4 tonnes a year. (Data: Average UK domestic electricity consumption; Climate Stewards footprint calculator). You can also work on making your home more energy efficient … saving emissions and money.
- not flying unless it’s absolutely necessary. The difference it can make in your footprint is truly astonishing. A return flight to New York adds about 1.7 tonnes to your footprint, Orlando 2.1 tonnes, Rio de Janeiro 2.8 tonnes, and Sydney? A whopping 5 tonnes. By contrast, Eurostar to Paris comes in at just … 4.1 kg. (Climate Stewards footprint calculator, Eurostar)
- using public transport, taking advantage of some of the amazing new technologies in electric vehicles (see our piece on electric cars and the information from the Energy Saving Trust) or getting exercise on our bikes or on foot for shorter journeys
- eating less meat … or switching to a vegetarian or vegan diet
All of this becomes even more significant if we encourage others. What if your church encouraged people to switch to green energy and ten families did?
We can encourage our Government to increase its ambitions on carbon reduction, help Britain adapt to a changing climate, and work to ensure that other people have what they need to develop sustainably and to adapt.
- Hope for the Future is a leading advocacy charity that helps people develop positive relationships with their MPs around climate issues. They have great advice on how to approach and hold good conversations with MPs (contact us for a copy of their handbook) as well as issue briefings covering topics from health and climate change to decarbonisation of heating and the encouragement of renewable energy.
And we can encourage businesses to act responsibly on climate issues:
- The Oxford Martin Principles for Climate-Conscious Investment “provide a framework for engagement between climate-conscious investors and companies across the global economy.” It focuses on planning for net zero emissions – which is something that both governments and businesses need to have at the heart of their strategies.
- Christian Aid’s Big Shift campaign is calling on UK banks to stop investing in fossil fuels.
- Operation Noah’s Bright Now campaign has information on divestment.
For Christians, taking this kind of action is a matter of faith, love, hope and joy.
- faith
because we believe that God made and loves the world and all that is in it. Caring for creation involves our affirming and proclaiming our faith in the Creator and the goodness of God’s work. - love
God calls us to love both God and our neighbour. If I work (however imperfectly) on reducing climate risks, I’m seeking to protect my neighbours, especially the most vulnerable, from losing their livelihoods or lives. That’s love in action.
If I don’t, it’s hard to claim to be part of a community of love.
So reducing climate risks is something we need to do – a central part of our discipleship, not an optional extra for ‘the greenies’. - hope
because we believe that God loves the world and reconciles all things in Christ. This gives us (as the excellent articles in Anvil’s Hope and the Environment issue indicate) both an ultimate hope and a proximate hope for the planet … a hope that results not in casual optimism but in loving perseverance and shared engagement - joy
Creation is a gift. The more we care for it, the more we come to appreciate the wonder of that gift and to rejoice in its beauty and diversity.
Sharing with others in the work of protecting creation can create new communities – we realise that we are bound together with brothers and sisters locally and around the world, and we share together in ways that create new bonds of action and affection. That’s a joyful thing!
Above alll, as Pope Francis says: “The entire material universe speaks of God’s love, his boundless affection for us” (Laudato Si 84)”. As we and our fellow humans come to understand this love better through our care for creation and each other, we encounter the source of all our joy.
*The large heat anomaly in northern Russia is actually particularly concerning from a climate perspective. This is why.

